
 Tiếng Việt
 中文 (中国)
 한국어
한국어
– Cây Đa (hard granules), produced by Sao Thái Dương company, is consists of these ingredients below:
Chinese Cork Tree Bark (Phellodendron chinense) 3.01 g, Chinese Pond Turtle Carapace And Plastron (Chinemys reevesii) 1.35 g, Chinese Foxglove Root (Rehmannia glutinosa) 0.94 g, Bai Shao Root (Paeonia alba) 0.90 g, Animal Bone Extract 0.88 g, Fu-Ling Sclerotium (Poria cocos) 0.62 g, Rubber Tree Bark (Eucommia ulmoides) 0.62 g, Dong Quai Root (Angelica sinensis) 0.38 g, Dang Shen Root (Codonopsis pilosula) 0.37 g, Siler Root (Saposhnikovia divaricata) 0.31 g, Taxillus Whole Plant (Taxillus chinensis) 0.31 g, Large Leaf Gentian Root (Gentiana macrophylla) 0.31g, Ox Knee Root (Achyranthes bidentata) 0.31 g, White Willow Extract (Salix alba) 0.5 g, Orange Peel (Citrus reticulata) 0.24 g, Peach Blossom Flower (Prunus persica) 0.23 g, Sichuan Lovage Rhizome (Ligusticum wallichii) 0.19 g, Liquorice Root (Glycyrrhiza glabra) 0.15 g, Du Huo Root (Angelica pubescens) 0.13 g, Cinnamon Stem/Branch (Cinnamomum cassia) 0.10 g, Asarum heterotropoides Root And Rhizome 0.07 g. Additives: Sodium Carboxymethyl Cellulose, Amidon, Hydroxypropyl Methylcellulose, Black Food Colouring 952.
– Packaging: 5 gram hard granules in one sachet.
– Dosage: 1 – 2 sachets per day (10 gram per day)
Chemical substances
– Monosodium-iodoacetate (MIA) (Sigma Aldrich, Singapore)
– Physiological saline
– Alcohol and betadine solution.
– IL1β, TNF-α assay kit for rat from Cloud-Clone, USA
– Histology Reagent Chemicals
Laboratory equipments
– Syringe, cotton ball
– Electric measurement (MC 555, HTMT Co., Ltd., China)
– Automated ELISA system (Biotek, America)
– Dynamic Plantar Aesthesiometer 37450 (Ugo Basile, Italy)
– Analgesy meter 7200 (Ugo Basile, Italy)
Experimental animals
Normal healthy male and female Wistar albino rats weighing between 220 g and 250 g were obtained from Vietnam Military Medical University, Ha Noi. The animals were allowed an acclimatization period of 7 days under laboratory conditions prior to the initiation of the study. They maintained for 12 hours in light and dark cycle in a well ventilated house, with free access to food and water at liberty.
All animals were treated according to international regulations on experimental animal treatments.
Experimental design
The research was performed according to a study by Kim et al [1]
Fifty male and female Wistar rats will be fed in Laboratory according to standard criteria for 10 days, then divided into 5 groups.
– Group I (control) will be given an intra-articular injection of physiological saline.
– Group II (MIA)
– Group III (MIA + diclofenac 3mg/kg/day, oral route)
– Group IV (MIA + Cây Đa 1.2g/kg/day, oral route)
– Group V (MIA + Cây Đa 3.6g/kg/day, oral route)
Group III, IV, V will be administered orally diclofenac, Cây Đa at doses of 3mg/kg/day, 1.2g/kg/day and 3.6g/kg/day respectively for 6 weeks after a single injection of MIA. MIA will be injected intra-articularly at dose 3mg/knee with volume of 50µl per knee [2],[3],[4],[5]
Anti-osteoarthritic effect of Cây Đa will be evaluated through the change of the diameter of right knee joints, serum IL-1β, TNF-α assay, the analgesic effect through pain threshold (using Dynamic Plantar Aesthesiometer and analgesy meter), and micro-histological images of knee joints.
Diameter of knees
Knee diameter must be measured by an electric measurement (MC 555, HTMT Co., Ltd., China). Knee diameter was measured by one researcher at all times to ensure consistency. Knee diameter was measured on: day 0, day 3, day 5, day 7, day 14, day 21, day 28, day 35, day 42 of treatment period. The evaluation index is the increase in knee diameter within each time interval [6].
The analgesic effect of Cây Đa using Dynamic Plantar Aesthesiometer
A dynamic plantar aesthesiometer is an automated system that allows measurement of the sensitivity threshold in one test with high repetitiveness [5]. It typically consists of a moveable touch-simulator unit, a framed metal mesh, an animal enclosure, and a microprocessor-controlled electronic unit. The animal moves freely within the enclosure positioned on the metal mesh. After the animal has acclimatized to the apparatus and stopped any exploratory behavior, the operator places the touch simulator below the animal’s paw. The unit then automatically raises the filament at a preset force until a signal is received that the animal has either moved its paw or the greatest preset force has been met. Latency to paw withdrawal and force exerted are recorded. In this study, the analgesic effect was assessed on right hind paw of rats, on: day 0, day 7, day 14, day 21, day 28, day 35, day 42 of treatment period.
The analgesic effect of Cây Đa according to Randall Selitto method
In the course of this pain test, a pressure of increasing intensity is applied to right knee joint of rats. The monitored reactions range from leg withdrawal reflexes (the rat withdraws its right hind leg) to more complex organized unlearned behaviors (escape or vocalization) [5]. The measured parameter is the threshold (weight in grams) for the appearance of a given behavior, at the time: day 0, day 7, day 14, day 21, day 28, day 35, day 42 of treatment period.
Cytokines
Interleukin 1β and TNF α are specific indicators of an increase in osteoarthritis (IL1β, TNF-α assay kit for rat from Cloud-Clone, USA). These indicators were quantified in the serum of rat at the end of the study [1]. Tests are done according to standard procedures and internal control assessment by the Department of Pathophysiology – Immunology, Medical University of Hanoi.
Histopathology of knee joints
Randomly assessing over 30% of rats at the end of the study, rats were anesthetized and had their right knee joints surgically removed from the body, preserved in formaldehyde solution 10%, assessed by pathologists of the Department of Pathological Anatomy – Hanoi Medical University.
Research location and time study
– Research location: Department of Pharmacology – Hanoi Medical University
– Research period: from September 2016 to June 2017
Statistical analysis
Results are expressed as mean ± SD. Data analysis was carried out using Student’s t test and paired t test using Microsoft Excel vers.2013. Significance was considered at values of p < 0.05.
*: p < 0.05; **: p < 0.01; ***: p < 0.001: compared with day 0
RESULTS
Diameter of knees
Table 2.1. Effect of Cây Đa in diameter of knees
| Groups | n | The increase in knee diameter (mm) (∆ = dt – d0) | |||||||
| Day 3 | Day 5 | Day 7 | Day 14 | Day 21 | Day 28 | Day 35 | Day 42 | ||
| Group I | 10 | 0,17 ± 0,05 | 0,15 ± 0,08 | 0,26 ± 0,11 | 0,08 ± 0,03 | 0,21 ±
0,06 |
0,06 ± 0,02 | 0,10 ± 0,03 | 0,11 ± 0,04 |
| Group II | 10 | 0,99 ± 0,30 | 1,42 ± 0,30 | 1,18 ± 0,32 | 0,95 ± 0,33 | 1,23 ±
0,44 |
1,08 ± 0,34 | 0,92 ± 0,34 | 0,84 ± 0,35 |
| p1 | <0,001 | <0,001 | <0,001 | <0,001 | <0,001 | <0,001 | <0,001 | <0,001 | |
| Group III | 10 | 0,66 ± 0,22 | 0,87 ± 0,31 | 0,92 ± 0,33 | 0,88 ± 0,32 | 0,63 ±
0,31 |
0,57 ± 0,25 | 0,62 ± 0,29 | 0,38 ± 0,16 |
| p1 | <0,001 | <0,001 | <0,001 | <0,001 | <0,001 | <0,001 | <0,001 | <0,001 | |
| p2 | <0,05 | <0,001 | >0,05 | >0,05 | <0,01 | <0,01 | <0,05 | <0,01 | |
| Group IV | 10 | 0,92 ± 0,28 | 1,14 ± 0,43 | 1,33 ± 0,50 | 0,70 ± 0,29 | 0,87 ±
0,34 |
0,76 ± 0,26 | 0,63 ± 0,25 | 0,56 ± 0,19 |
| p1 | <0,001 | <0,001 | <0,001 | <0,001 | <0,001 | <0,001 | <0,001 | <0,001 | |
| p2 | >0,05 | >0,05 | >0,05 | >0,05 | >0,05 | <0,05 | <0,05 | <0,05 | |
| p3 | <0,05 | >0,05 | <0,05 | >0,05 | >0,05 | >0,05 | >0,05 | <0,05 | |
| Group V | 10 | 0,95 ± 0,29 | 0,93 ± 0,25 | 1,16 ± 0,36 | 0,85 ± 0,24 | 0,85 ±
0,34 |
0,75 ± 0,21 | 0,51 ± 0,21 | 0,42 ± 0,14 |
| p1 | <0,001 | <0,001 | <0,001 | <0,001 | <0,001 | <0,001 | <0,001 | <0,001 | |
| p2 | >0,05 | <0,001 | >0,05 | >0,05 | <0,05 | <0,05 | <0,01 | <0,01 | |
| p3 | <0,05 | >0,05 | >0,05 | >0,05 | >0,05 | >0,05 | >0,05 | >0,05 | |
| p4 | >0,05 | >0,05 | >0,05 | >0,05 | >0,05 | >0,05 | >0,05 | >0,05 | |
p1: compared with control
p2: compared with Group II (MIA)
p3: compared with Group III (MIA + diclofenac 3mg/kg)
p4: compared with Group IV (MIA + Cây Đa 1.2g/kg)
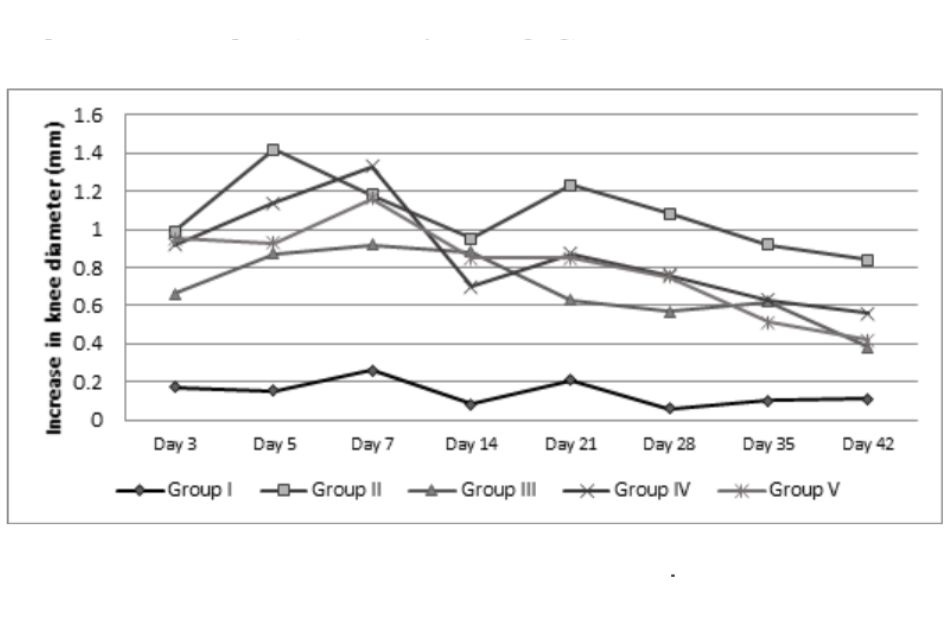
Figure 2.1. Increase in knee diameter of rats
The results in Table 2.1 and Figure 2.1 show that:
– The increase in the diameter of knee joints of MIA-injected osteoarthritis-induced rats increased significantly compared to the control group, the difference was statistically significant with p < 0.001.
– The knee diameter of rats increased the most on day 5, day 7 and day 21.
– In Group III (MIA + diclofenac 3mg/kg), the increase in the diameter of knee joints in rats decreased significantly compared to Group II (MIA only) at all times, especially day 3, day 5, day 21, day 28, day 35 and day 42 (p < 0.05, p < 0.01 and p < 0.001)
– In Group IV (MIA + Cây Đa 1.2g/kg), the increase in diameter of knee joints in rats was reduced compared to Group II (MIA only), but markedly after 4 weeks, 5 weeks and 6 weeks of MIA injection, the difference is statistically significant with p < 0.05. The decrease at week 4 and week 5 were equivalent to Group III (MIA + diclofenac 3mg/kg) (p > 0.05), but less than Group 3 after 6 weeks (p <0.05).
– In Group V (MIA + Cây Đa 3.6g/kg), the increase in diameter of knee joints in rats decreased significantly compared to Group II (MIA only) at all times, especially on day 3, day 21, day 28, day 35 and day 42 (p < 0.05, p < 0.01 and p < 0.001), this decrease is equivalent to Group III (MIA + diclofenac 3mg/kg) (p > 0.05).
2.2. The analgesic effect of Cây Đa using Dynamic Plantar Aesthesiometer
Table 2.2. Paw withdrawal threshold
| Groups | n | Paw withdrawal threshold (g) | ||||||
| Day 0 | Day 7 | Day 14 | Day 21 | Day 28 | Day 35 | Day 42 | ||
| Group I | 10 | 19,55 ± 4,62 | 21,84 ± 5,88 | 21,59 ± 3,80 | 20,93 ± 3,30 | 20,72 ± 6,72 | 22,29 ± 5,34 | 22,36 ± 4,11 |
| Group II | 10 | 19,53 ± 5,19 | 16,93 ± 3,43 | 20,33 ± 2,82 | 23,86 ± 8,59 | 22,63 ± 3,85 | 27,08 ± 4,29** | 27,21 ± 4,24*** |
| p1 | > 0,05 | < 0,05 | > 0,05 | > 0,05 | > 0,05 | < 0,05 | < 0,05 | |
| Group III | 10 | 19,23 ± 2,86 | 18,02 ± 2,87 | 18,91 ± 5,02 | 23,07 ± 5,40 | 22,51 ± 4,53 | 22,37 ± 4,52 | 22,04 ± 5,58 |
| p1 | > 0,05 | > 0,05 | > 0,05 | > 0,05 | > 0,05 | > 0,05 | > 0,05 | |
| p2 | > 0,05 | > 0,05 | > 0,05 | > 0,05 | > 0,05 | < 0,05 | < 0,05 | |
| Group IV | 10 | 19,64 ± 5,19 | 15,39 ± 3,97 | 18,89 ± 4,86 | 23,31 ± 6,17 | 23,41 ± 8,48 | 23,71 ± 6,15* | 22,86 ± 4,36 |
| p1 | > 0,05 | < 0,05 | > 0,05 | > 0,05 | > 0,05 | > 0,05 | > 0,05 | |
| p2 | > 0,05 | > 0,05 | > 0,05 | > 0,05 | > 0,05 | > 0,05 | < 0,05 | |
| p3 | > 0,05 | > 0,05 | > 0,05 | > 0,05 | > 0,05 | > 0,05 | > 0,05 | |
| Group V | 10 | 19,68 ± 4,02 | 17,09 ± 5,06 | 19,08 ± 4,20 | 22,52 ± 3,02 | 21,92 ± 4,66 | 23,59 ± 6,82 | 22,29 ± 6,00 |
| p1 | > 0,05 | > 0,05 | > 0,05 | > 0,05 | > 0,05 | > 0,05 | > 0,05 | |
| p2 | > 0,05 | > 0,05 | > 0,05 | > 0,05 | > 0,05 | > 0,05 | < 0,05 | |
| p3 | > 0,05 | > 0,05 | > 0,05 | > 0,05 | > 0,05 | > 0,05 | > 0,05 | |
| p4 | > 0,05 | > 0,05 | > 0,05 | > 0,05 | > 0,05 | > 0,05 | > 0,05 | |
The results in Table 2.2 show that:
– Group I: the paw withdrawal threshold had no difference at all times compared to day 0 (p > 0.05).
– Group II:
+ After 1 week of MIA injection, the paw withdrawal threshold decreased compared to day 0 (p < 0.05), and decreased significantly compared to Group I (p < 0.05). At this time, the right knee joints of the rats were much inflamed so the rats were very sensitive to the mechanical stimuli.
+ After 2 weeks and 4 weeks of MIA injection, the paw withdrawal threshold increased, there was no difference compared with day 0 and compared with the control group (p > 0.05).
+ After 5 weeks and 6 weeks of MIA injection, the paw withdrawal threshold significantly increased due to the degenerative damage of the knee joints of the rats, so the mechanical stimuli increased. The paw withdrawal threshold on day 35 and day 42 increased significantly compared to day 0 (p < 0.01 and p < 0.001) and compared with the control group (p < 0.05).
– Group III:
+ After 1 week of MIA injection, the paw withdrawal threshold increased compared to day 0 and control group, but the difference was not statistically significant (p> 0.05). The paw withdrawal threshold increased compared to Group II, but the difference was not statistically significant (p > 0.05).
+ After 2 weeks and 4 weeks of MIA injection, the paw withdrawal threshold increased. There was no difference compared to day 0, control group and Group II (p > 0.05).
+ After 6 weeks of MIA injection, the paw withdrawal threshold was not different from day 0 and compared with the control group (p > 0.05), but significantly reduced compared to Group II (p < 0.05).
– Group IV:
+ One week after MIA injection, the paw withdrawal threshold was not different compared with day 0, Group II and Group III (p > 0.05), but significantly reduced compared to the control group (p < 0.05).
+ After 2 weeks and 4 weeks of MIA injection, the paw withdrawal threshold increased. There was no difference compared to day 0 and control group at the same time (p > 0.05).
+ At day 35, the paw withdrawal threshold increased compared to day 0 (p < 0.05). At day 42, the mechanical stimuli decreased but no difference compared to day 0 (p > 0.05). At both times, the paw withdrawal threshold was not different from the control group (p > 0.05), but decreased significantly compared to Group II (p <0.05).
+ Cây Đa 1.2g/kg was as effective as diclofenac 3mg/kg
– Group V:
+ One week after MIA injection, the paw withdrawal threshold was not different compared with day 0, Group II and Group III (p> 0.05).
+ After 2 weeks and 4 weeks of MIA injection, the paw withdrawal threshold increased. There was no difference compared to day 0 and control group at the same time (p > 0, 05).
+ At day 35 and day 42, the paw withdrawal threshold was not different from day 0 (p> 0.05). There was no difference between the mechanical stimuli of Group V and the control group (p > 0,05). At day 42, the paw withdrawal threshold was significantly reduced compared to Group II (p <0.05)
+ Cây Đa 3.6g/kg was as effective as diclofenac 3mg/kg
Table 2.3. Latency to paw withdrawal
| Groups | n | Latency to paw withdrawal (s) | ||||||
| Day 0 | Day 7 | Day 14 | Day 21 | Day 28 | Day 35 | Day 42 | ||
| Group I | 10 | 11,33 ± 2,73 | 12,96 ± 3,57 | 12,08 ± 3,23 | 13,83 ± 3,02 | 12,28 ± 4,08 | 13,45 ± 2,59 | 13,74 ± 2,15 |
| Group II | 10 | 11,55 ± 3,16 | 9,96 ± 2,06 | 11,47 ± 2,08 | 14,19 ± 5,21 | 13,47 ± 2,34 | 16,43 ± 2,58** | 16,86 ± 3,74** |
| p1 | > 0,05 | < 0,05 | > 0,05 | > 0,05 | > 0,05 | < 0,05 | < 0,05 | |
| Group III | 10 | 11,38 ± 1,74 | 10,65 ± 1,73 | 11,20 ± 3,05 | 14,13 ± 4,45 | 13,63 ± 2,41 | 13,26 ± 2,73 | 13,09 ± 3,38 |
| p1 | > 0,05 | > 0,05 | > 0,05 | > 0,05 | > 0,05 | > 0,05 | > 0,05 | |
| p2 | > 0,05 | > 0,05 | > 0,05 | > 0,05 | > 0,05 | < 0,05 | < 0,05 | |
| Group IV | 10 | 11,63 ± 3,15 | 9,05 ± 2,73 | 11,16 ± 2,93 | 13,83 ± 3,74 | 13,91 ± 5,14 | 14,30 ± 4,10* | 13,61 ± 2,66 |
| p1 | > 0,05 | < 0,05 | > 0,05 | > 0,05 | > 0,05 | > 0,05 | > 0,05 | |
| p2 | > 0,05 | > 0,05 | > 0,05 | > 0,05 | > 0,05 | > 0,05 | < 0,05 | |
| p3 | > 0,05 | > 0,05 | > 0,05 | > 0,05 | > 0,05 | > 0,05 | > 0,05 | |
| Group V | 10 | 11,66 ± 2,44 | 10,07 ± 3,00 | 11,55 ± 2,70 | 13,39 ± 1,84 | 13,04 ± 2,89 | 14,07 ± 4,15 | 13,45 ± 3,37 |
| p1 | > 0,05 | > 0,05 | > 0,05 | > 0,05 | > 0,05 | > 0,05 | > 0,05 | |
| p2 | > 0,05 | > 0,05 | > 0,05 | > 0,05 | > 0,05 | > 0,05 | < 0,05 | |
| p3 | > 0,05 | > 0,05 | > 0,05 | > 0,05 | > 0,05 | > 0,05 | > 0,05 | |
| p4 | > 0,05 | > 0,05 | > 0,05 | > 0,05 | > 0,05 | > 0,05 | > 0,05 | |
The results in Table 2.3 show that:
– Group I: the latency paw withdrawal had no difference at all times compared to day 0 (p > 0.05).
– Group II:
+ After 1 week of MIA injection, the latency paw withdrawal had no difference compared to day 0 (p < 0.05), but decreased significantly compared to Group I (p < 0.05). At this time, the right knee joints of the rats were much inflamed so the rats were very sensitive to the mechanical stimuli, shortening reaction time to stimuli.
+ After 2 weeks and 4 weeks of MIA injection, the reaction time to stimuli increased but there was no difference compared with day 0 and compared with the control group (p > 0.05).
+ After 5 weeks and 6 weeks of MIA injection, the reaction time to stimuli was significantly increased due to the degenerative damage of the knee joints of the rats. The latency paw withdrawal on day 35 and day 42 increased significantly compared to day 0 (p < 0.01) and compared with the control group (p < 0.05).
– Group III:
+ After 1 week of MIA injection, the latency paw withdrawal increased compared to day 0 and control group, but the difference was not statistically significant (p > 0.05). The latency paw withdrawal increased compared to Group II, but the difference was not statistically significant (p > 0.05).
+ After 2 weeks and 4 weeks of MIA injection, the latency paw withdrawal increased. There was no difference compared to day 0, control group and Group II (p > 0, 05).
+ After 5 weeks and 6 weeks of MIA injection, the reaction time to stimuli was not different from day 0 and compared with the control group (p > 0.05), but significantly reduced compared to Group II (p < 0.05). This result showed diclofenac 3mg/kg improved knee joint movement of rats.
– Group IV:
+ One week after MIA injection, the reaction time to stimuli was not different compared with day 0, Group II and Group III (p> 0.05), but significantly reduced compared to the control group (p < 0.05).
+ After 2 weeks and 4 weeks of MIA injection, the latency paw withdrawal increased. There was no difference compared to day 0 and control group at the same time (p > 0, 05).
+ At day 35, the latency paw withdrawal increased compared to day 0 (p <0.05). At day 42, the reaction time to stimuli decreased but no difference compared to day 0 (p > 0.05). At both times, the latency paw withdrawal was not different from the control group (p > 0.05), but decreased significantly compared to Group II (p < 0.05).
+ Cây Đa 1.2g/kg was as effective as diclofenac 3mg/kg
– Group V:
+ One week after MIA injection, the latency paw withdrawal was not different compared with day 0, Group II and Group III (p> 0.05).
+ After 2 weeks and 4 weeks of MIA injection, the reaction time to stimuli increased. There was no difference compared to day 0 and control group at the same time (p > 0.05).
+ At day 35 and day 42, the latency paw withdrawal was not different from day 0 (p > 0.05). There was no difference between the reaction time to stimuli of Group V and the control group (p > 0,05). At day 42, the reaction time to stimuli was significantly reduced compared to Group II (p <0.05)
+ Cây Đa 3.6g/kg was as effective as diclofenac 3mg/kg
2.3. The analgesic effect of Cây Đa using Randall Selitto method
Table 2.4. The pressure pain threshold of the knee joints
| Groups | n | Pressure pain threshold (g) | ||||||
| Day 0 | Day 7 | Day 14 | Day 21 | Day 28 | Day 35 | Day 42 | ||
| Group I | 10 | 275,00 ±
65,19 |
257,00 ±
59,64 |
255,60 ±
92,41 |
333,00 ± 100,01 | 312,00 ±
90,28 |
316,00 ±
98,23 |
315,00 ±
56,22 |
| Group II | 10 | 295,00 ±
97,10 |
185,00 ±
44,03** |
179,50 ±
67,60* |
245,00 ±
83,30 |
276,00 ±
58,73 |
268,00 ±
95,78 |
233,00 ±
81,11 |
| p1 | > 0,05 | < 0,01 | < 0,05 | < 0,05 | > 0,05 | > 0,05 | < 0,05 | |
| Group III | 10 | 286,80 ±
84,46 |
322,00 ±
86,26 |
328,00 ±
134,06 |
348,00 ±
109,93 |
331,00 ±
68,22 |
341,00 ±
52,38 |
351,20 ±
107,03 |
| p1 | > 0,05 | > 0,05 | > 0,05 | > 0,05 | > 0,05 | > 0,05 | > 0,05 | |
| p2 | > 0,05 | < 0,001 | < 0,01 | < 0,05 | > 0,05 | < 0,05 | < 0,05 | |
| Group IV | 10 | 279,09 ±
68,77 |
321,82 ±
99,78 |
277,27 ±
86,61 |
286,36 ±
83,22 |
286,36 ±
86,29 |
294,55 ±
91,58 |
299,09 ±
95,76 |
| p1 | > 0,05 | > 0,05 | > 0,05 | > 0,05 | > 0,05 | > 0,05 | > 0,05 | |
| p2 | > 0,05 | < 0,001 | < 0,01 | > 0,05 | > 0,05 | > 0,05 | > 0,05 | |
| p3 | > 0,05 | > 0,05 | > 0,05 | > 0,05 | > 0,05 | > 0,05 | > 0,05 | |
| Group V | 10 | 301,00 ±
74,90 |
333,00 ±
102,85 |
299,50 ±
104,84 |
321,00 ±
118,18 |
378,00 ±
110,03 |
321,00 ±
88,63 |
314,00 ±
81,27 |
| p1 | > 0,05 | > 0,05 | > 0,05 | > 0,05 | > 0,05 | > 0,05 | > 0,05 | |
| p2 | > 0,05 | < 0,001 | < 0,01 | > 0,05 | < 0,05 | > 0,05 | < 0,05 | |
| p3 | > 0,05 | > 0,05 | > 0,05 | > 0,05 | > 0,05 | > 0,05 | > 0,05 | |
| p4 | > 0,05 | > 0,05 | > 0,05 | > 0,05 | < 0,05 | > 0,05 | > 0,05 | |
The results in Table 2.4 show that:
– Group I: the pressure pain threshold of the knee joints had no difference at all times compared to day 0 (p > 0.05).
– Group II: the pressure pain threshold of the knee joints decreased compared to day 0, markedly at day 7 and day 14 (p < 0.05, p < 0.01). The pain threshold decreased compared to the control group, markedly on day 7, day 14, day 21 and day 42 (p < 0.05, p < 0.01).
– Group III: there were no difference between the pain threshold in Group III and Group I (p > 0.05). The pain threshold of the knee joints increased compared to Group II, markedly at day 7, day 14, day 21, day 35 and day 42 (p < 0.05, p < 0.01, p < 0.001).
– Group IV: there were no difference between the pain threshold in Group IV and Group I (p > 0.05). The pain threshold of the knee joints increased compared to Group II, markedly at day 7 and day 14 (p < 0.01, p < 0.001). Cây Đa 1.2g/kg/day was not as effective as diclofenac 3mg/kg.
– Group V: there were no difference between the pain threshold in Group IV and Group I (p > 0.05). The pain threshold of the knee joints increased compared to Group II, markedly at day 7, day 14, day 28 and day 42 (p < 0.05, p < 0.01, p < 0.001). Cây Đa 3.6g/kg/day was more effective than Cây Đa 1.2g/kg/day, and as effective as diclofenac 3mg/kg/day.
Cytokines
Table 2.5. Interleukin 1β
| Groups | Interleukin-1β
(pg/ml) |
p1 | p2 | p3 | p4 |
| Group I | 142,85 ± 44,39 | ||||
| Group II | 185,33 ± 45,13 | < 0,05 | |||
| Group III | 152,56 ± 19,44 | > 0,05 | < 0,05 | ||
| Group IV | 155,02 ± 39,57 | > 0,05 | > 0,05 | > 0,05 | |
| Group V | 145,53 ± 22,34 | > 0,05 | < 0,05 | > 0,05 | > 0,05 |
p1: compared with control
p2: compared with Group II (MIA)
p3: compared with Group III (MIA + diclofenac 3mg/kg)
p4: compared with Group IV (MIA + Cây Đa 1.2g/kg)
The results in Table 2.5 show that:
After 6 weeks of treatment period:
+ Group II: the concentration of interleukin-1β increased significantly compared to the control group (p < 0.05).
+ Group III: the concentration of interleukin-1β decreased compared to Group II (p < 0.05), tended to increase slightly compared to control group but the difference was not statistically significant (p > 0.05).
+ Group IV: the concentration of interleukin-1β tended to decrease compared to group II but the difference is not statistically significant (p > 0.05), tended to increase compared to the control group but the difference was not statistically significant (p > 0.05).
+ Group V: the concentration of interleukin-1β decreased significantly compared to Group II (p < 0.05) and tended to decrease compared to Group III but the difference was not statistically significant (p > 0.05).
Table 2.6. Tumor necrosis factor – α
| Groups | TNF-α
(pg/ml) |
p1 | p2 | p3 | p4 |
| Group I | 5,83 ± 1,67 | ||||
| Group II | 8,70 ± 2,83 | < 0,05 | |||
| Group III | 6,03 ± 1,93 | > 0,05 | < 0,05 | ||
| Group IV | 8,51 ± 2,21 | < 0,01 | > 0,05 | < 0,05 | |
| Group V | 6,29 ± 1,46 | > 0,05 | < 0,05 | > 0,05 | < 0,05 |
p1: compared with control
p2: compared with Group II (MIA)
p3: compared with Group III (MIA + diclofenac 3mg/kg)
p4: compared with Group IV (MIA + Cây Đa 1.2g/kg)
The results in Table 2.6 show that:
After 6 weeks of treatment period:
+ Group II: the concentration of TNF-α increased significantly compared to the control group (p < 0.05).
+ Group III: the concentration of TNF-α decreased compared to Group II (p < 0.05), tended to increase slightly compared to control group but the difference was not statistically significant (p > 0.05).
+ Group IV: the concentration of TNF-α tended to decrease compared to group II but the difference was not statistically significant (p > 0.05), increased compared to the control group (p < 0.01).
+ Group V: the concentration of TNF-α decreased significantly compared to Group II (p < 0.05) and tended to decrease compared to Group III and the control group but the difference was not statistically significant (p > 0.05). Cây Đa 3.6g/kg/day was more effective than Cây Đa 1.2g/kg/day.
Effects of Cây Đa on histopathology of knee joints
Table 2.7. Histopathological changes in knee joints of rats
| Groups | Histopathological changes |
| Group I | There is no subchondral bone and cartilage damage, no loss of proteoglycan dye layer. There are no degeneration of synovial cells, no necrotic chondrocytes. |
| Group II | Moderate subchondral bone and cartilage damage, loss of proteoglycan staining, degenerative synovial cells. Ghost chondrocytes and necrotic chondrocytes appeared, indicating irregularity of tidemark. Irregular thinning, fragmentation and fibrillation of thinned cartilage. Joint space is narrow. Subchondral cysts with mucoid fluid surrounded by sclerotic bone. Many osteophytes appeared. Synovial area with granulation tissue and chronic inflammation. |
| Group III | Mild subchondral bone and cartilage damage, mild loss of proteoglycan staining and synovial cells degeneration. Mild narrowing of the joint space. There are few osteophytes. There is fibrous and chondrocytes proliferation. Damage of cartilage structure decreased compared to model group. |
| Group IV | Mild subchondral bone and cartilage damage, mild loss of proteoglycan staining and synovial cells degeneration. Mild narrowing of the joint space. There are few osteophytes. There is fibrous and chondrocytes proliferation. Damage of cartilage structure decreased compared to model group. |
| Group V | Mild subchondral bone and cartilage damage, mild loss of proteoglycan staining and synovial cells degeneration. Mild narrowing of the joint space. There are few osteophytes. There is fibrous and chondrocytes proliferation. Damage of cartilage structure decreased compared to model group. |
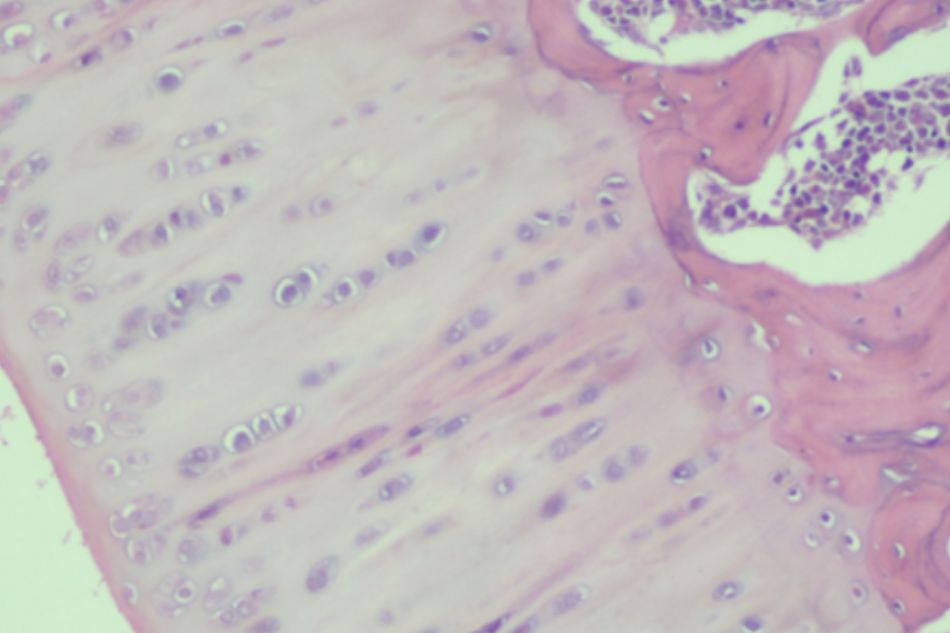
Figure 2.2. Knee joint sample in Group I (rat no.1)
Normal structure of knee joint
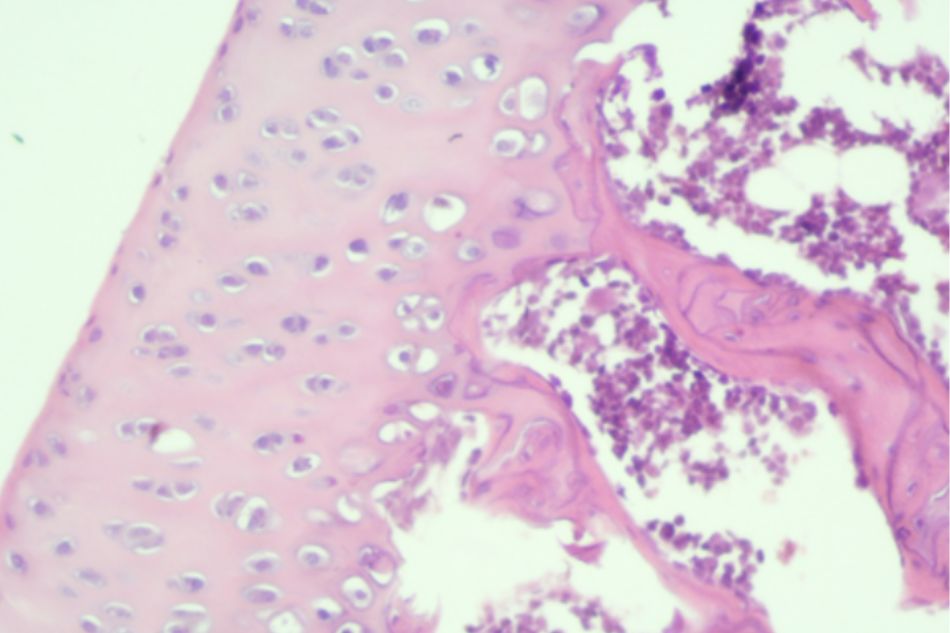
Figure 2.3. Knee joint sample in Group I (rat no.2)
Normal structure of knee joint
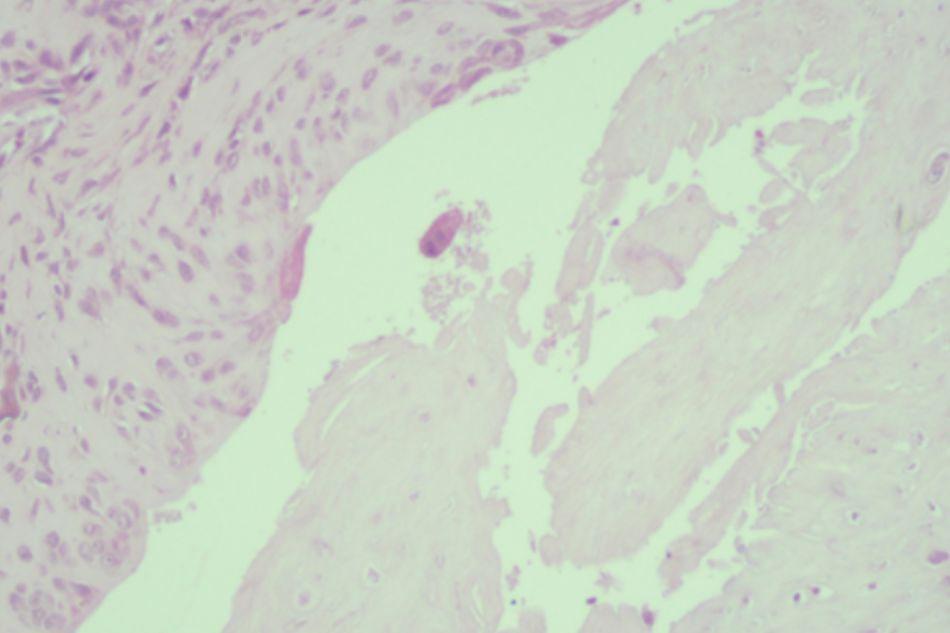
Figure 2.3. Knee joint sample in Group II (rat no.11)
Moderate subchondral bone and cartilage damage
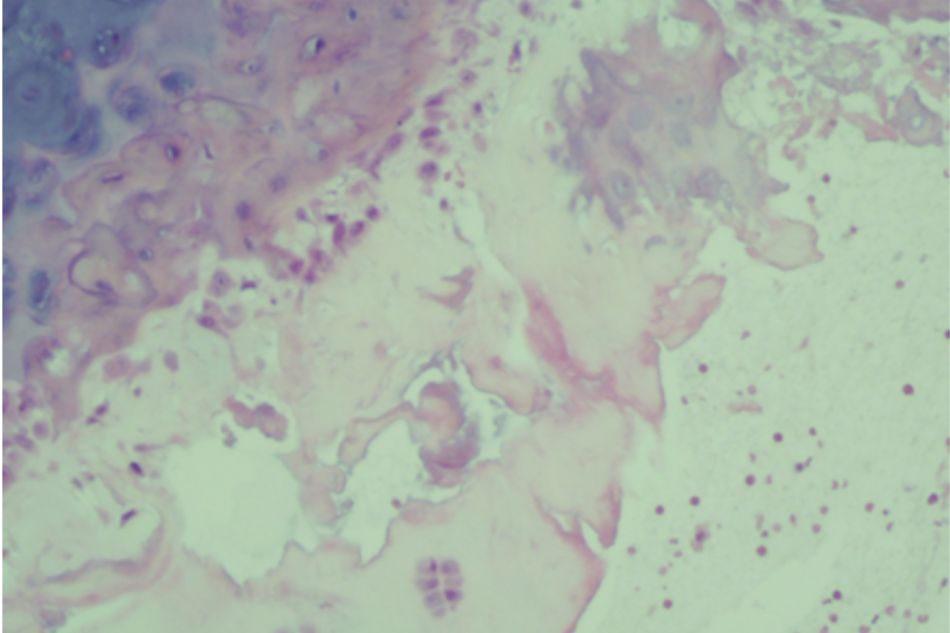
Figure 2.4. Knee joint sample in Group II (rat no.12)
Moderate subchondral bone and cartilage damage
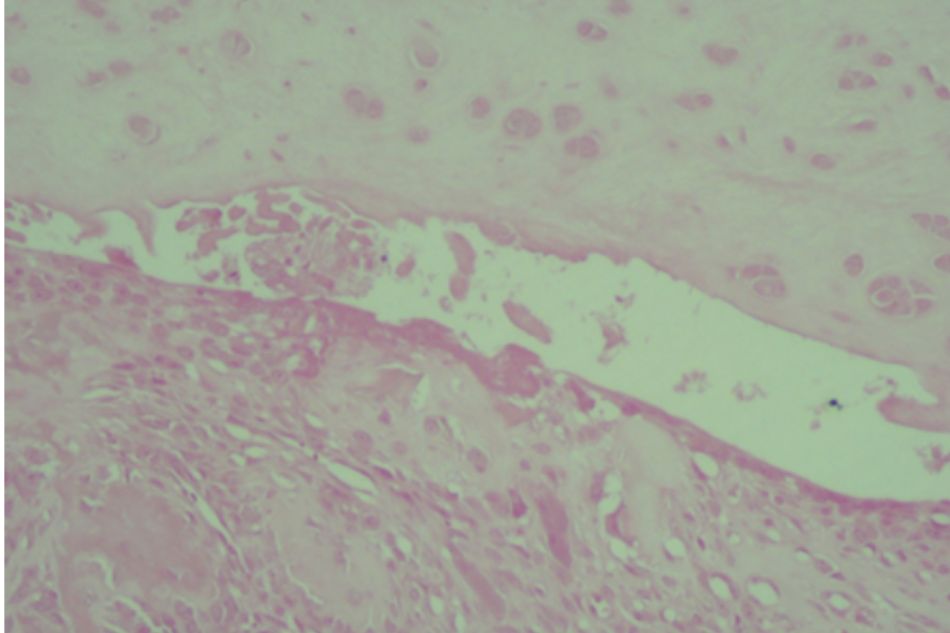
Figure 2.5. Knee joint sample in Group III (rat no.21)
Mild subchondral bone and cartilage damage
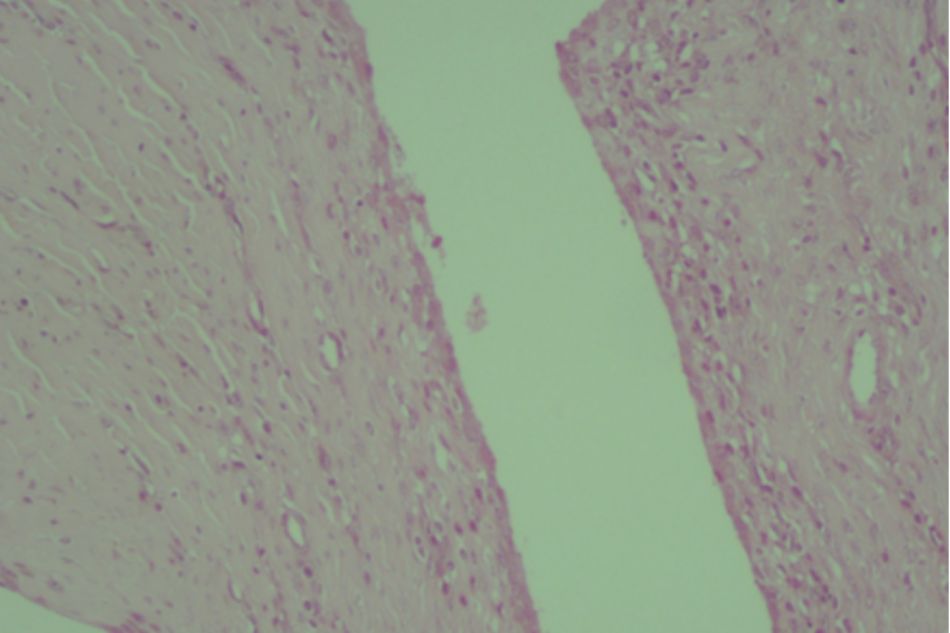
Figure 2.6. Knee joint sample in Group III (rat no.22)
Mild subchondral bone and cartilage damage

Figure 2.7. Knee joint sample in Group IV (rat no.41)
Mild subchondral bone and cartilage damage
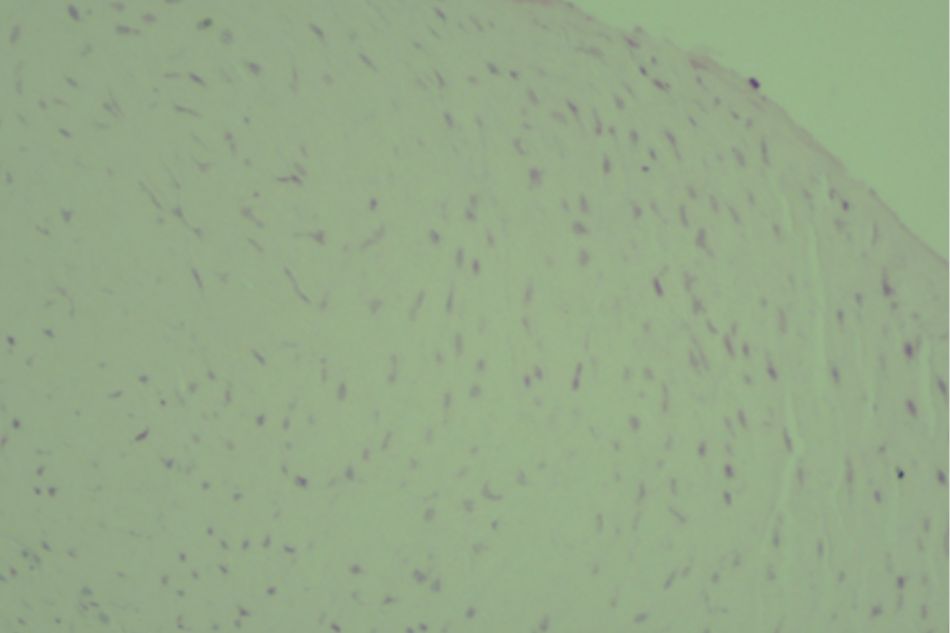
Figure 2.8. Knee joint sample in Group IV (rat no.42)
Mild subchondral bone and cartilage damage
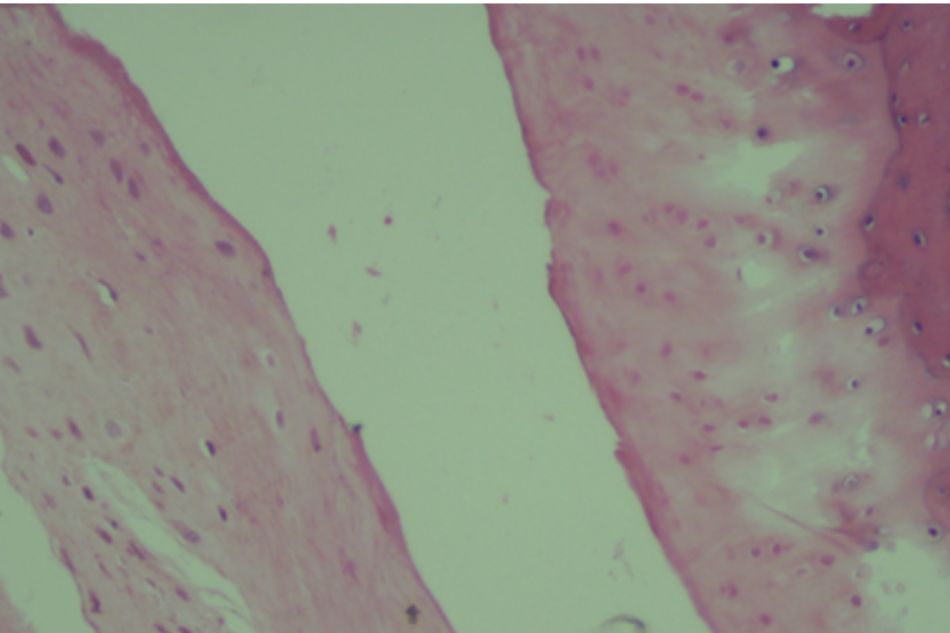
Figure 2.9. Knee joint sample in Group V (rat no.31)
Mild subchondral bone and cartilage damage
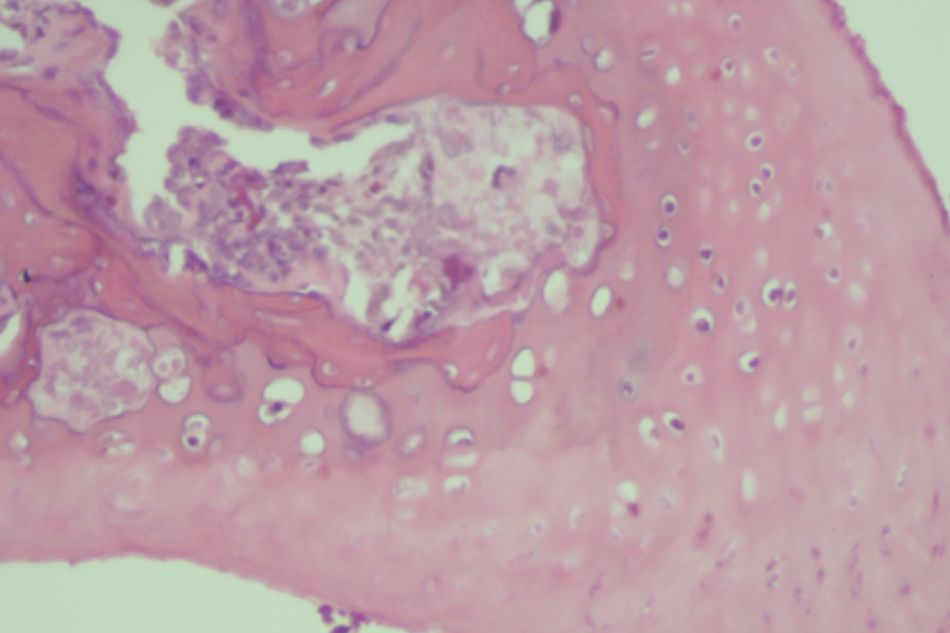
Figure 2.10. Knee joint sample in Group V (rat no.32)
Mild subchondral bone and cartilage damage
Conclusion
Cây Đa hard pills sample delivered by Sao Thai Duong Company to the Department of Pharmacology, Hanoi Medical University, on May 2016, required to evaluate the anti- osteoarthritis effect on rats at a dose of 1.2g/kg/day and 3.6g/kg/day, oral route, for 6 weeks. The results of the study show that:
– Cây Đa at dose of 1.2g/kg/day had anti-osteoarthritis effect on monosodium iodoacetate – induced osteoarthritis in rats shown by:
+ Effect of reducing knee swelling, reducing pain and improving knee joint movement on models using Dynamic Plantar Aesthesiometer
+ Pain relief effect at the knee joint on the model using the threshold pain measuring machine according to Randall Selitto method.
+ Effects on improving cartilage structure shown on histopathology of knee joint structure.
– Cây Đa at dose of 3.6g/kg/day had anti-osteoarthritis effect on monosodium iodoacetate – induced osteoarthritis in rats shown by:
+ Effect of reducing knee swelling, reducing pain and improving knee joint operation on models using Dynamic Plantar Aesthesiometer
+ Pain relief effect at the knee joint on the model using the threshold pain measuring machine according to Randall Selitto method.
+ The effect of reducing interleukin-1β and TNF-α level
+ Effects on improving cartilage structure shown on histopathology of knee joint structure.
+ Cây Đa at dose 3.6g/kg/day was more effective than Cây Đa at dose 1.2g/kg/day.